1. OPERASI TITIK
a. Mengubah
image dalam format 8 bit grayscale
>>
a=imread('retro.jpg');
>>
b=rgb2gray(a);
>>
c=uint8(b);
>>
subplot(1,2,1),imshow(a)
>>
title('image original')
>>
subplot(1,2,2),imshow(c)
>> title('image
gray')
b. Penjumlahan
>>
penjumlahan=imadd(c,150);
>>
subplot(1,2,1),imshow(c)
>>
title('image gray')
>>
subplot(1,2,2),imshow(penjumlahan)
>>
title('image penjumlahan 150')
c. Pengurangan
>>
pengurangan=imsubtract(c,150);
>> subplot(1,2,1),imshow(c)
>>
title('image gray')
>>
subplot(1,2,2),imshow(pengurangan)
>>
title('image pengurangan 150')
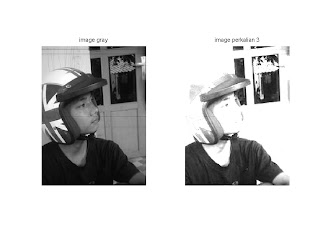
d. Perkalian
>>
perkalian=immultiply(c,3);
>>
subplot(1,2,1),imshow(c)
>>
title('image gray')
>>
subplot(1,2,2),imshow(perkalian)
>> title('image
perkalian 3')
e. Pembagian
>>
pembagian=imdivide(c,3);
>>
subplot(1,2,1),imshow(c)
>>
title('image gray')
>>
subplot(1,2,2),imshow(pembagian)
>>
title('image pembagian 3')
f.
Komplemen
>>
komplemen=imcomplement(c);
>>
subplot(1,2,1),imshow(c)
>> title('image
gray')
>>
subplot(1,2,2),imshow(komplemen)
>>
title('image komplemen')
2. OPERASI
HISTOGRAM
a. Operasi
histogram Streching menggunakan persamaan sendiri
2. Operasi histogram streching
b. Operasi
Histogram Streching
>>
A=imread('retro.jpg');
>>
B=imadjust(A,[0.20 0.5],[0.3 0.9],1);
>>
C=imadjust(A,[0.20 0.5],[0.3 0.9],0.5);
>>
D=imadjust(A,[0.20 0.5],[0.3 0.9],2);
>>
subplot(4,2,1),imshow(A)
>>
title('image original')
>>
subplot(4,2,2),imhist(A)
>> title('histogram
original')
>>
subplot(4,2,3),imshow(B)
>>
title('gama 1')
>>
subplot(4,2,4),imhist(B)
>>
title('histogram gama 1')
>>
subplot(4,2,5),imshow(C)
>>
title('gama 0.5')
>>
subplot(4,2,6),imhist(C)
>>
title('histogram gama 0.5')
>> subplot(4,2,7),imshow(D)
>>
title('gama 2')
>>
subplot(4,2,8),imhist(D)
>>
title('histogram gama 2')
c. Operasi Histogram Equalisasi
>>
A=imread('retro.jpg');
>>
B=histeq(A);
>>
subplot(2,2,1),imshow(A)
>>
title('image original')
>>
subplot(2,2,2),imhist(A)
>>
title('histogram original')
>>
subplot(2,2,3),imshow(B)
>>
title('image histeq')
>>
subplot(2,2,4),imhist(B)
3. NEIGHBORHOOD PROCESSING
a. Filter
fspecial
>>
X1=fspecial('average',[8,8])
X1 =
Columns 1 through 6
0.0156
0.0156 0.0156 0.0156
0.0156 0.0156
0.0156
0.0156 0.0156 0.0156
0.0156 0.0156
0.0156
0.0156 0.0156 0.0156
0.0156 0.0156
0.0156
0.0156 0.0156 0.0156
0.0156 0.0156
0.0156
0.0156 0.0156
0.0156 0.0156 0.0156
0.0156
0.0156 0.0156 0.0156
0.0156 0.0156
0.0156
0.0156 0.0156 0.0156
0.0156 0.0156
0.0156
0.0156 0.0156 0.0156
0.0156 0.0156
Columns 7 through 8
0.0156
0.0156
0.0156
0.0156
0.0156
0.0156
0.0156
0.0156
0.0156
0.0156
0.0156
0.0156
0.0156
0.0156
0.0156
0.0156
>>
X2=fspecial('disk')
X2 =
Columns 1 through 6
0
0 0
0.0012 0.0050 0.0063
0
0.0000 0.0062 0.0124
0.0127 0.0127
0
0.0062 0.0127 0.0127
0.0127 0.0127
0.0012
0.0124 0.0127 0.0127
0.0127 0.0127
0.0050
0.0127 0.0127 0.0127
0.0127 0.0127
0.0063
0.0127 0.0127 0.0127
0.0127 0.0127
0.0050
0.0127 0.0127 0.0127
0.0127 0.0127
0.0012
0.0124 0.0127 0.0127
0.0127 0.0127
0
0.0062 0.0127 0.0127
0.0127 0.0127
0
0.0000 0.0062 0.0124
0.0127 0.0127
0
0 0
0.0012 0.0050 0.0063
Columns 7 through 11
0.0050
0.0012 0 0 0
0.0127
0.0124 0.0062 0.0000
0
0.0127
0.0127 0.0127 0.0062 0
0.0127
0.0127 0.0127 0.0124
0.0012
0.0127
0.0127 0.0127 0.0127
0.0050
0.0127
0.0127 0.0127 0.0127
0.0063
0.0127
0.0127 0.0127 0.0127
0.0050
0.0127
0.0127 0.0127 0.0124
0.0012
0.0127
0.0127 0.0127 0.0062 0
0.0127
0.0124 0.0062 0.0000
0
0.0050 0.0012 0
0
0
>>
X3=fspecial('gaussian')
X3 =
0.0113
0.0838 0.0113
0.0838
0.6193 0.0838
0.0113
0.0838 0.0113
>>
X4=fspecial('laplacian')
X4 =
0.1667
0.6667 0.1667
0.6667
-3.3333 0.6667
0.1667
0.6667 0.1667
>>
X5=fspecial('log')
X5 =
0.0448
0.0468 0.0564 0.0468
0.0448
0.0468
0.3167 0.7146 0.3167
0.0468
0.0564
0.7146 -4.9048 0.7146
0.0564
0.0468
0.3167 0.7146 0.3167
0.0468
0.0448
0.0468 0.0564 0.0468
0.0448
>>
X6=fspecial('motion')
X6 =
Columns 1 through 6
0.1111
0.1111 0.1111 0.1111
0.1111 0.1111
Columns 7 through 9
0.1111
0.1111 0.1111
>>
X7=fspecial('prewitt')
X7 =
1
1 1
0
0 0
-1
-1 -1
>>
X8=fspecial('sobel')
X8 =
1
2 1
0
0 0
-1
-2 -1
>> X9=fspecial('unsharp')
X9 =
-0.1667
-0.6667 -0.1667
-0.6667
4.3333 -0.6667
-0.1667
-0.6667 -0.1667
b. Filter2
image
>>
A=imread('retro.jpg');
>>
B=rgb2gray(A);
>>
C=filter2(X1,B);
>>
C1=filter2(X2,B);
>>
C2=filter2(X3,B);
>> C3=filter2(X4,B);
>>
C4=filter2(X5,B);
>>
C5=filter2(X6,B);
>>
C6=filter2(X7,B);
>>
C7=filter2(X8,B);
>>
C8=filter2(X9,B);
>>
subplot(4,3,2),imshow(A)
>>
title('image original')
>>
subplot(4,3,4),imshow(uint8(C))
>>
title('AVERAGE')
>>
subplot(4,3,5),imshow(uint8(C1))
>>
title('DISK')
>>
subplot(4,3,6),imshow(uint8(C2))
>>
title('GAUSSIAN')
>>
subplot(4,3,7),imshow(uint8(C3))
>>
title('LAPLACIAN')
>>
subplot(4,3,8),imshow(uint8(C4))
>>
title('L0G')
>>
subplot(4,3,9),imshow(uint8(C5))
>>
title('MOTION')
>> subplot(4,3,10),imshow(uint8(C6))
>>
title('PREWITT')
>>
subplot(4,3,11),imshow(uint8(C7))
>>
title('SOBEL')
>>
subplot(4,3,12),imshow(uint8(C8))
>>title(‘UNSHARP’)
KONVOLUSI
Proses
filtering image yang sering dilakukan pada proses pengolahan gambar. Pada
matlab terdapat banyak sekali cara yang dapat dilakukan untuk melakukan
proseskonvolusi. Proses konvolusi dilakukan dengan menggunakan matriks yang
biasa disebut mask yaitu matriks yang berjalan sepanjang proses dan digunalan
untuk menghitung nilai representasi lokal dari beberapa piksel pada image
>> A=imread('retro.jpg');
>> B=rgb2gray(A);
>> C=uint8(B);
>> mask=[-1 -1 -1;-1 8 -1;-1 -1 -1]
mask =
-1 -1 -1
-1 8
-1
-1 -1 -1
>> D=graythresh(B);
>> E=im2bw(B,D);
>> F=conv2(double(E),mask,'valid');
>> imshow(F)


Tidak ada komentar:
Posting Komentar
silahkan berkomentar dengan baik dan bijak